
The highs and lows of the Rhine
August 22, 2026
3 min read
This summer, low water levels in the Netherlands' rivers have caused widespread concern and prompted much discussion. When I was young, however, high water seemed to be the greater threat.
I vividly remember the flood of 1995, when around 250,000 people had to be evacuated. My school closed for two weeks, and when my room flooded, I had to move upstairs. Despite all that, it felt a little like an extra Christmas holiday.
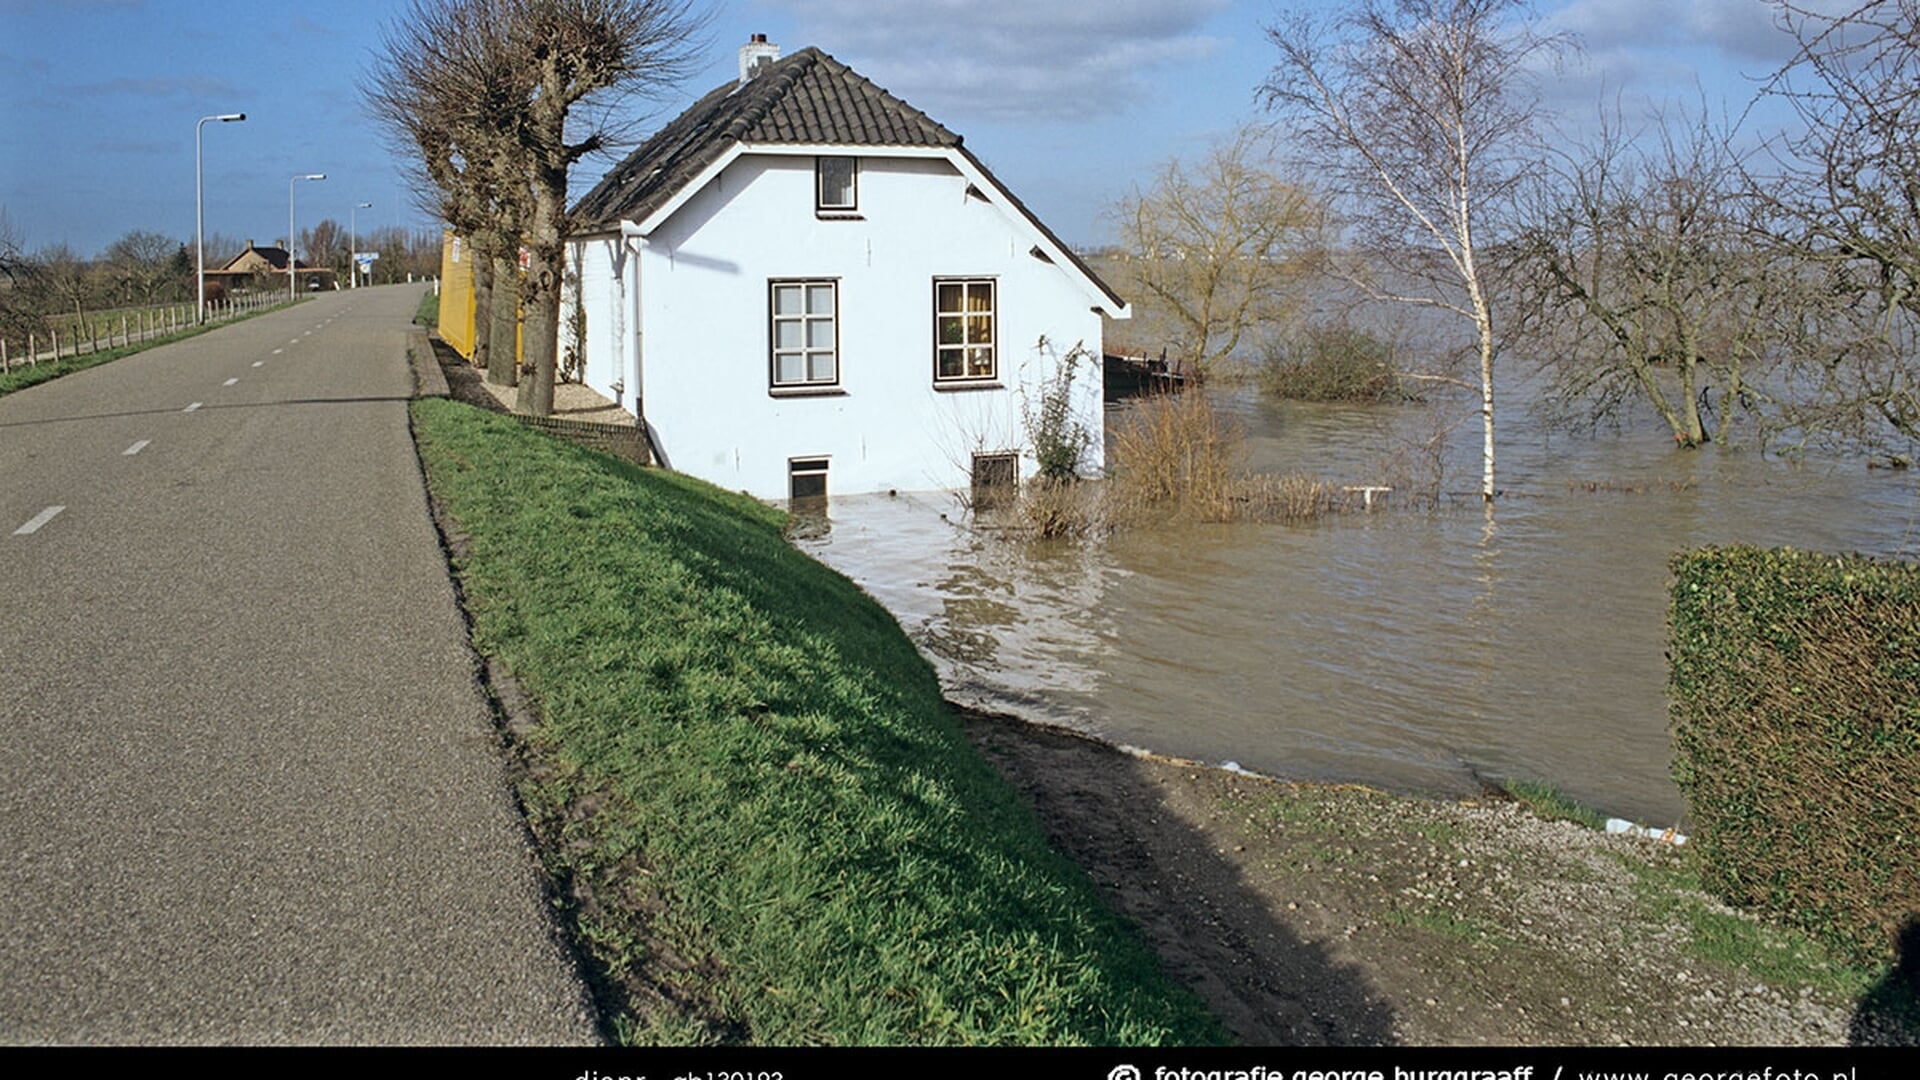
Photo credit1
I wanted to know whether my memory matched the historical record. Has the Rhine shifted from frequent high water to lower levels? I downloaded the data to see what patterns might emerge.
Each line below shows one year at Lobith, from January to December. The record begins in 1901. As new years appear, older ones recede. At the end, the field rotates to reveal the full landscape over time.
1901
Drag charts to rotateRiver flowat Lobith · m³/s
1901: river flow 1.105-5.655 m³/s · water level 934-1.456 cm NAP
Flow and water level
River flow, technically called discharge, is the volume of water passing Lobith each second. It reveals recurring winter peaks, summer lows, floods and droughts.
Water level is the height of the water surface relative to a fixed reference point. It depends on flow, but also on the shape and depth of the channel.
The river bed near Lobith has gradually eroded. River engineering made the channel narrower and fixed it in place, while less sediment arrives to replace what the current carries away. As the bed sinks, the water surface also sits lower, even when the same volume of water passes Lobith. Research into the Dutch Rhine branches documents this long-term change in bed level.
In both panels, color compares each day with the historical average for that time of year. Blue is below average, grey is close to it and orange is above it, with the outer shades reserved for the most extreme days. Matching ridges represent the same dates and years.
One difference stands out. On days when flow was between 1,800 and 2,200 m³/s, the median water level fell from 1,110 cm NAP in 1901-1920 to 908 cm NAP in 2006-2025. That is about two metres lower for a comparable flow.
This changes how the record should be read. Water level combines changes in flow with changes in the river itself, so a downward trend does not necessarily mean less water is passing Lobith. The relationship between water level and flow must therefore be recalibrated as the channel changes, as reflected in Rijkswaterstaat's periodically updated water-level and flow relationships. For comparing water quantity over time, river flow is the more reliable signal.
Data
The daily record runs from 1901 through 2025, plus 2026 through the latest observation. The source is Rijkswaterstaat WaterWebservices at Lobith. Flow uses daily discharge values. Water level is measured in centimetres relative to the national reference datum, NAP, and averaged by day when multiple observations are available.
Footnotes
-
Photo: © Fotografie George Burggraaff, 2007, as published by the Culemborgse Courant. ↩